My blog is inside my SIEM
Overview
What if I told you that everything about this blog is monitored, and has detections behind it to ensure that everything remains smooth? I’ll use this post to talk about how this blog is actually set-up and what things I am able to track and what detections I can create with it. All of this is connected into my homelab which I will likely make dedicated posts to show how to create one for yourself. For now, lets just focus on the what, and the how.
How is detection diary set-up?
This is actually a fairly simple setup for a blog. We are not really using any CMS here (I lied… I am using Sveltia CMS for the Git-based approach where everything I upload and push are to a Git repository). When I say no CMS, I mean there is no Wordpress, or “server” backend here. I am using Astro which is a Javascript based web framework that allows me to build the site into its core html/js/css components so I dont need a backend server. Its probably easier if I show you the full flow in a diagram and then talk about it.
flowchart TB
  V(["Visitor"])

  subgraph gh["GitHub (deploy path)"]
    GA["GitHub Actions<br/>push to main"]
  end

  subgraph aws["AWS us-east-1"]
    direction TB
    CF["CloudFront"]
    SITE[("S3 site bucket<br/>private + OAC")]
    LOGS[("S3 access-log bucket")]
    SNS["SNS topic"]
    SQS["SQS queue"]
    IAM["IAM deploy role"]
  end

  subgraph lab["Homelab Splunk (black box for this post)"]
    direction LR
    TA["Splunk AWS TA<br/>SQS-based S3 input"] --> IDX[("index=detectiondiary")] --> OUT["Dashboards +<br/>tamper-detection search"]
  end

  V -->|"HTTPS"| CF
  CF -->|"origin fetch (OAC)"| SITE
  CF -->|"access logs"| LOGS
  LOGS -->|"event notification"| SNS
  SNS -->|"SNS-wrapped (gotcha 1)"| SQS
  SQS --> TA
  GA -->|"OIDC assume (gotcha 2)"| IAM
  IAM -->|"s3 sync + invalidation"| SITE
Breakdown
Whenever I decide that I want to make a new post, like this one you are reading (or skimming) through now, I am creating a md file within a local docker container of “Sveltia CMS”. This headless CMS takes my local Github token that is scoped just for this private repository and then pushes my new pages to the main branch. Instantaniously, Github Actions picks up on that push and starts a workflow I created - which will statically build the site, and update the files and folders in AWS S3 using a specific deploy role. It will then invalidate Cloudfront so that it picks up on the new pages and after a refresh, you see the new blog post.
I kind of went through how it gets uploaded fairly quickly. Essentially, I push to Git, Github Actions uses a specific AWS role to push the new pages and update the site being sent out via Cloudfront. Thats all for the uploading piece.
When it comes to getting the logging data, AWS Cloudfront allows us to send our access logs to an S3 bucket. This bucket will contain the access logs of whenever someone hits the page. This has information like who was it (ip address), when, where, and some response header information like the status code. When this log hits S3, an notification is sent to an AWS SNS topic (which is Amazons Simple Notification Service pub/sub messaging service.) The data from that topic then goes to a “queue” (Amazone Simple Queue Service SQS) where it sits there.
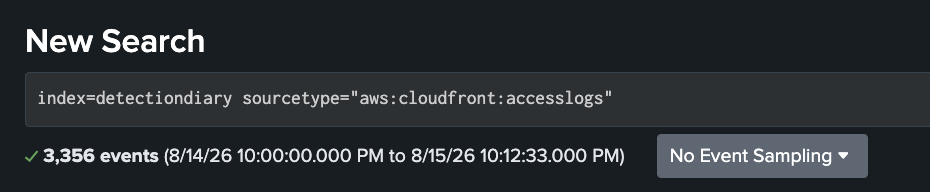
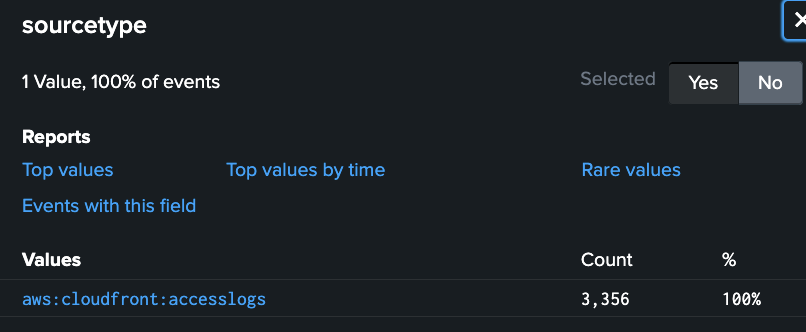
We then installed the “Splunk Add-on for Amazon Web Services (AWS)” which is add-on for Splunk that allows us to fetch the logs from the SQS queue and pop it into our index that we created specifically for our blog page. We can see this below with our successful ingest and sourcetype.
I omitted this from this explanation as it can be in another post for setting up the homelab, however, we also have the AWS cloudtrail logs going into this Splunk instance. We will be able to see anytime that the s3 bucket was updated via the PutObject method and get details about that. That can help us create specific rules to look for oddities like someone trying to upload to our site without going through the proper route which is one of the rules I will show you now.
Tamper Detection
Now that you have a high level understanding of how the blog works from a high level, there are a few places I’d be interested in to know if something went wrong with our blog page. Some places include:
- Someone pushing content without Github Actions
- Deploy role being used for odd actions.
- Odd connection attempts (Unresonable ones)
- Anything I want (as long as the data exists)
Lets look at how the PutObject appears in the logs, more specifically the CloudTrail logs.
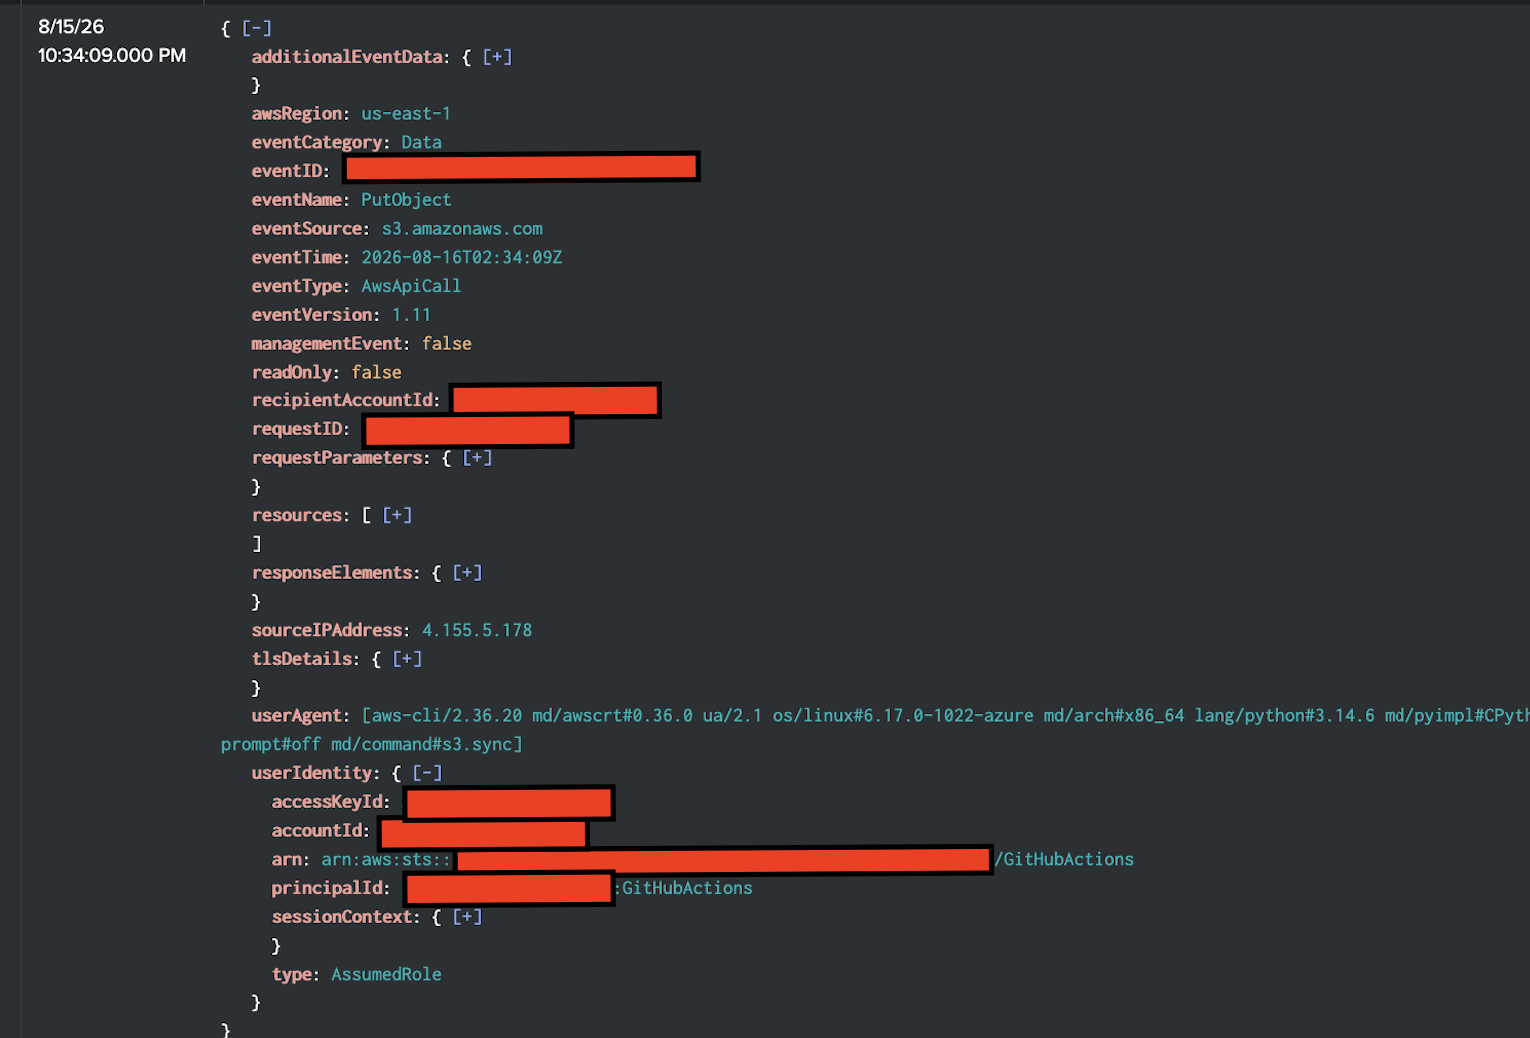
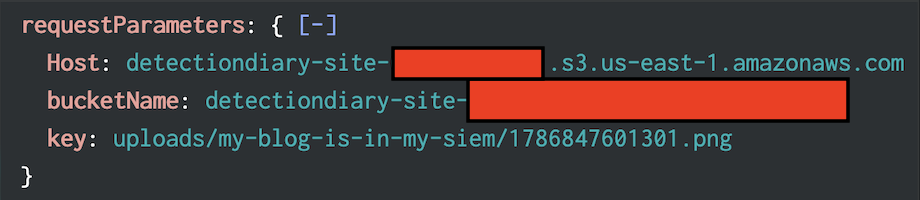 We can see from the IP and the ARN, that this event was done by Github Actions. If we look closely, we can probably think of a few different detections that can tell us if something is not right. One immediate one is based on that first bullet point. Lets say that someone other than Github Actions added a file to that S3 bucket. Maybe someone compromised the AWS account or another user on there that had permissions. They can now control what gets pushed onto the site. Not a good thing at all.
You can find all the specific actions that you can do with S3 on AWS documentation here: https://docs.aws.amazon.com/AmazonS3/latest/API/API_Operations.html However, for the sake of this blog post, I will create a very simple detection rule that will look for PutObject/DeleteObject being used from my bucket where the username is not the github deploy user.
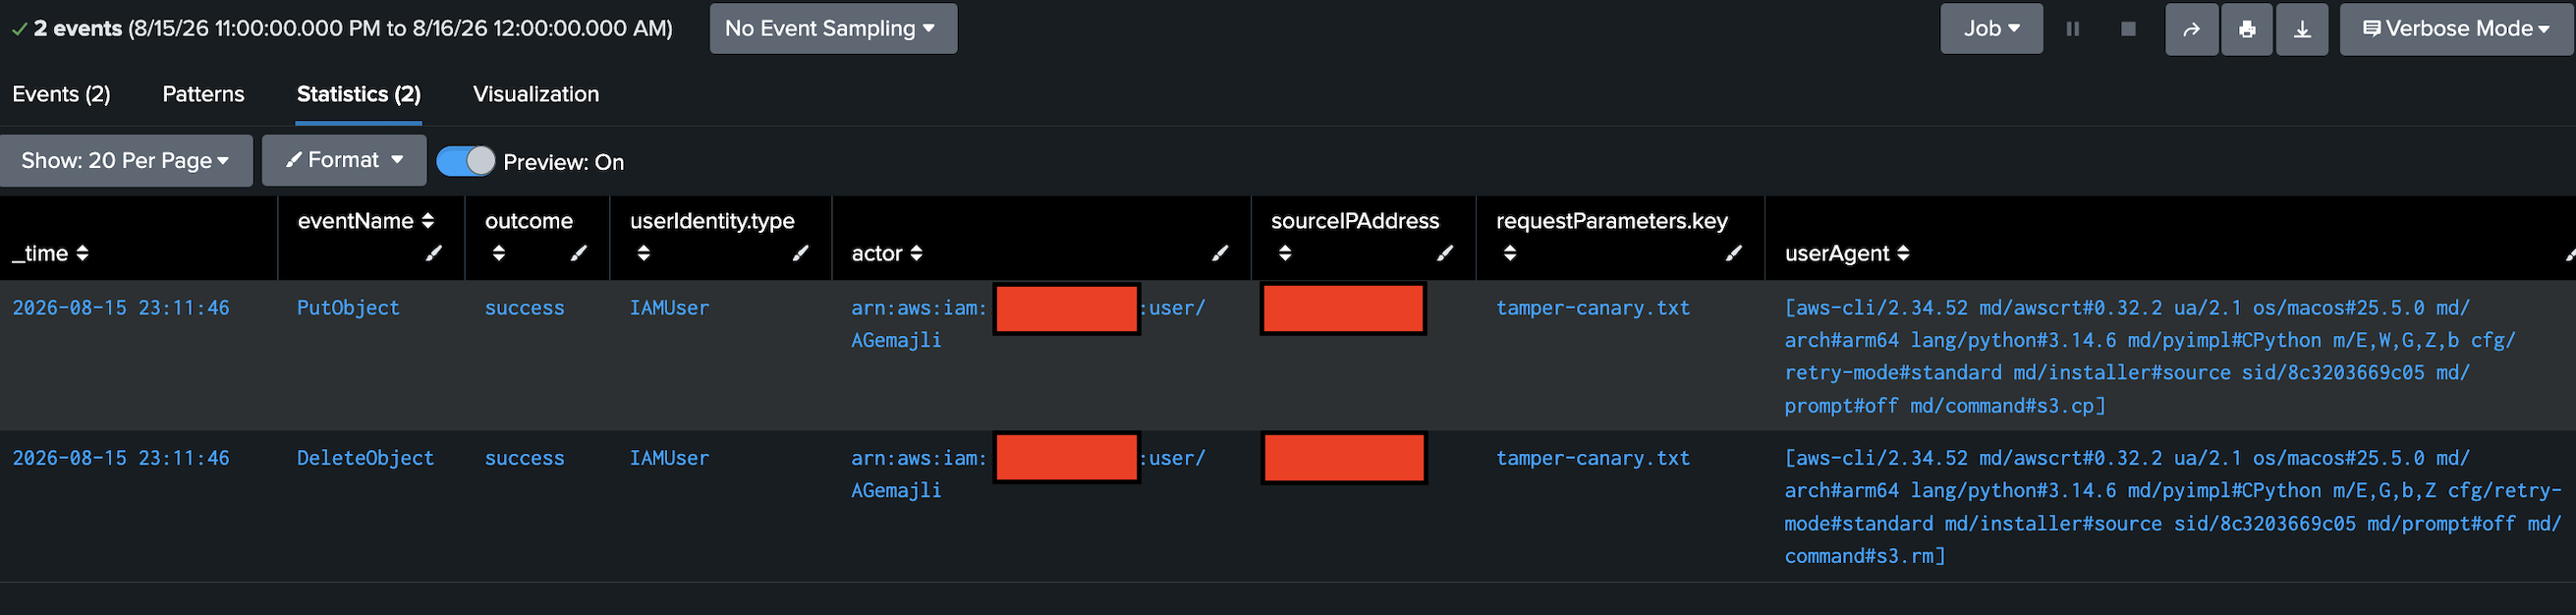
index=detectiondiary sourcetype=aws:cloudtrail eventSource=s3.amazonaws.com(eventName=PutObject OR eventName=DeleteObject)requestParameters.bucketName="detectiondiary-site-<redacted>"NOT userIdentity.sessionContext.sessionIssuer.userName="detectiondiary-github-deploy"| eval actor=coalesce('userIdentity.arn','userIdentity.principalId','userIdentity.accountId')| eval outcome=errorCode| table _time, eventName, outcome, userIdentity.type, actor, sourceIPAddress, requestParameters.key, userAgent| sort - _timeThe above search should show us wherever someone tried to PutObject or DeleteObject where the username is not the detectiondiary-github-deploy user with the bucket being the one where our objects sit in. I redacted the AWS account number.
So can we see this working? Well, if you look below, you can see that we tested our detection by using one of my privileed accounts to add a tamper-canary file into the S3 bucket and then deleted it, all with the CLI. We can see when it was done, who did it, what the filename was, and we can always go into the verbose setting to see more.
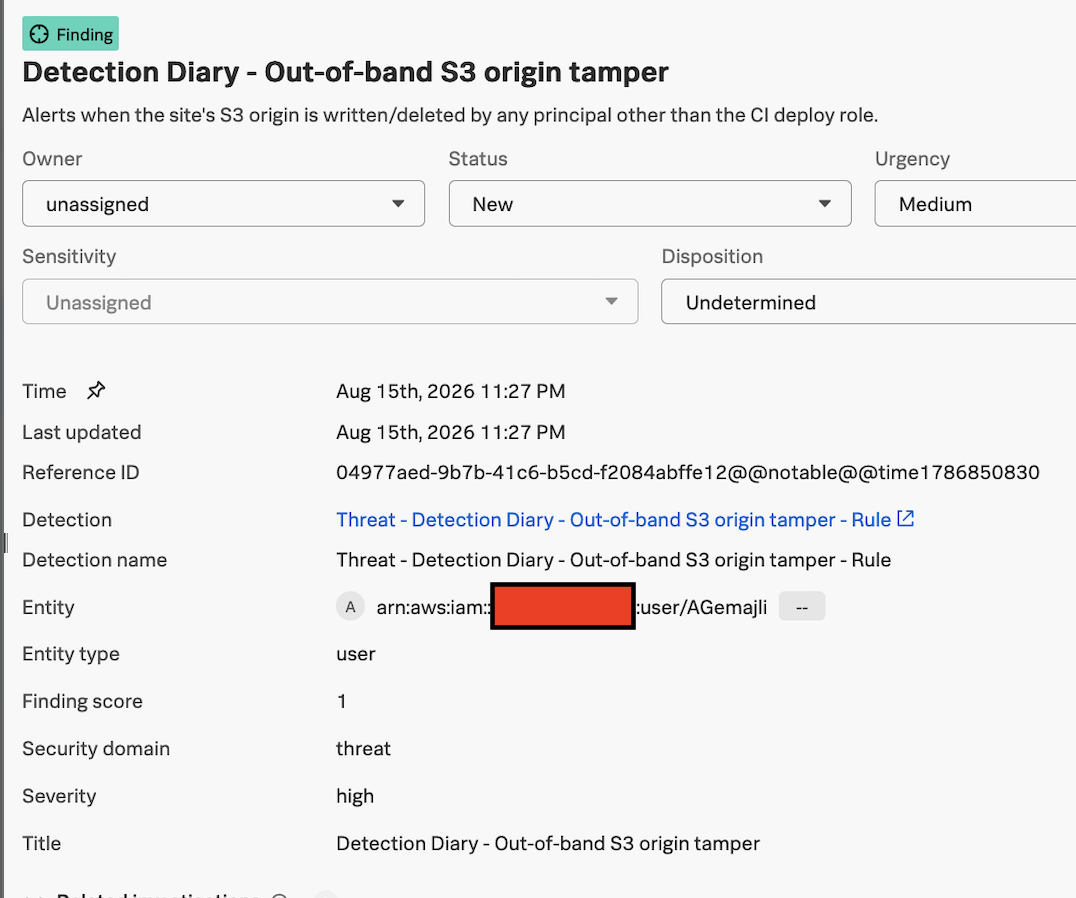
Using this logic, we created the detection rule in Splunk ES and saw it pop into our Finding Queue seen below
Conclusion
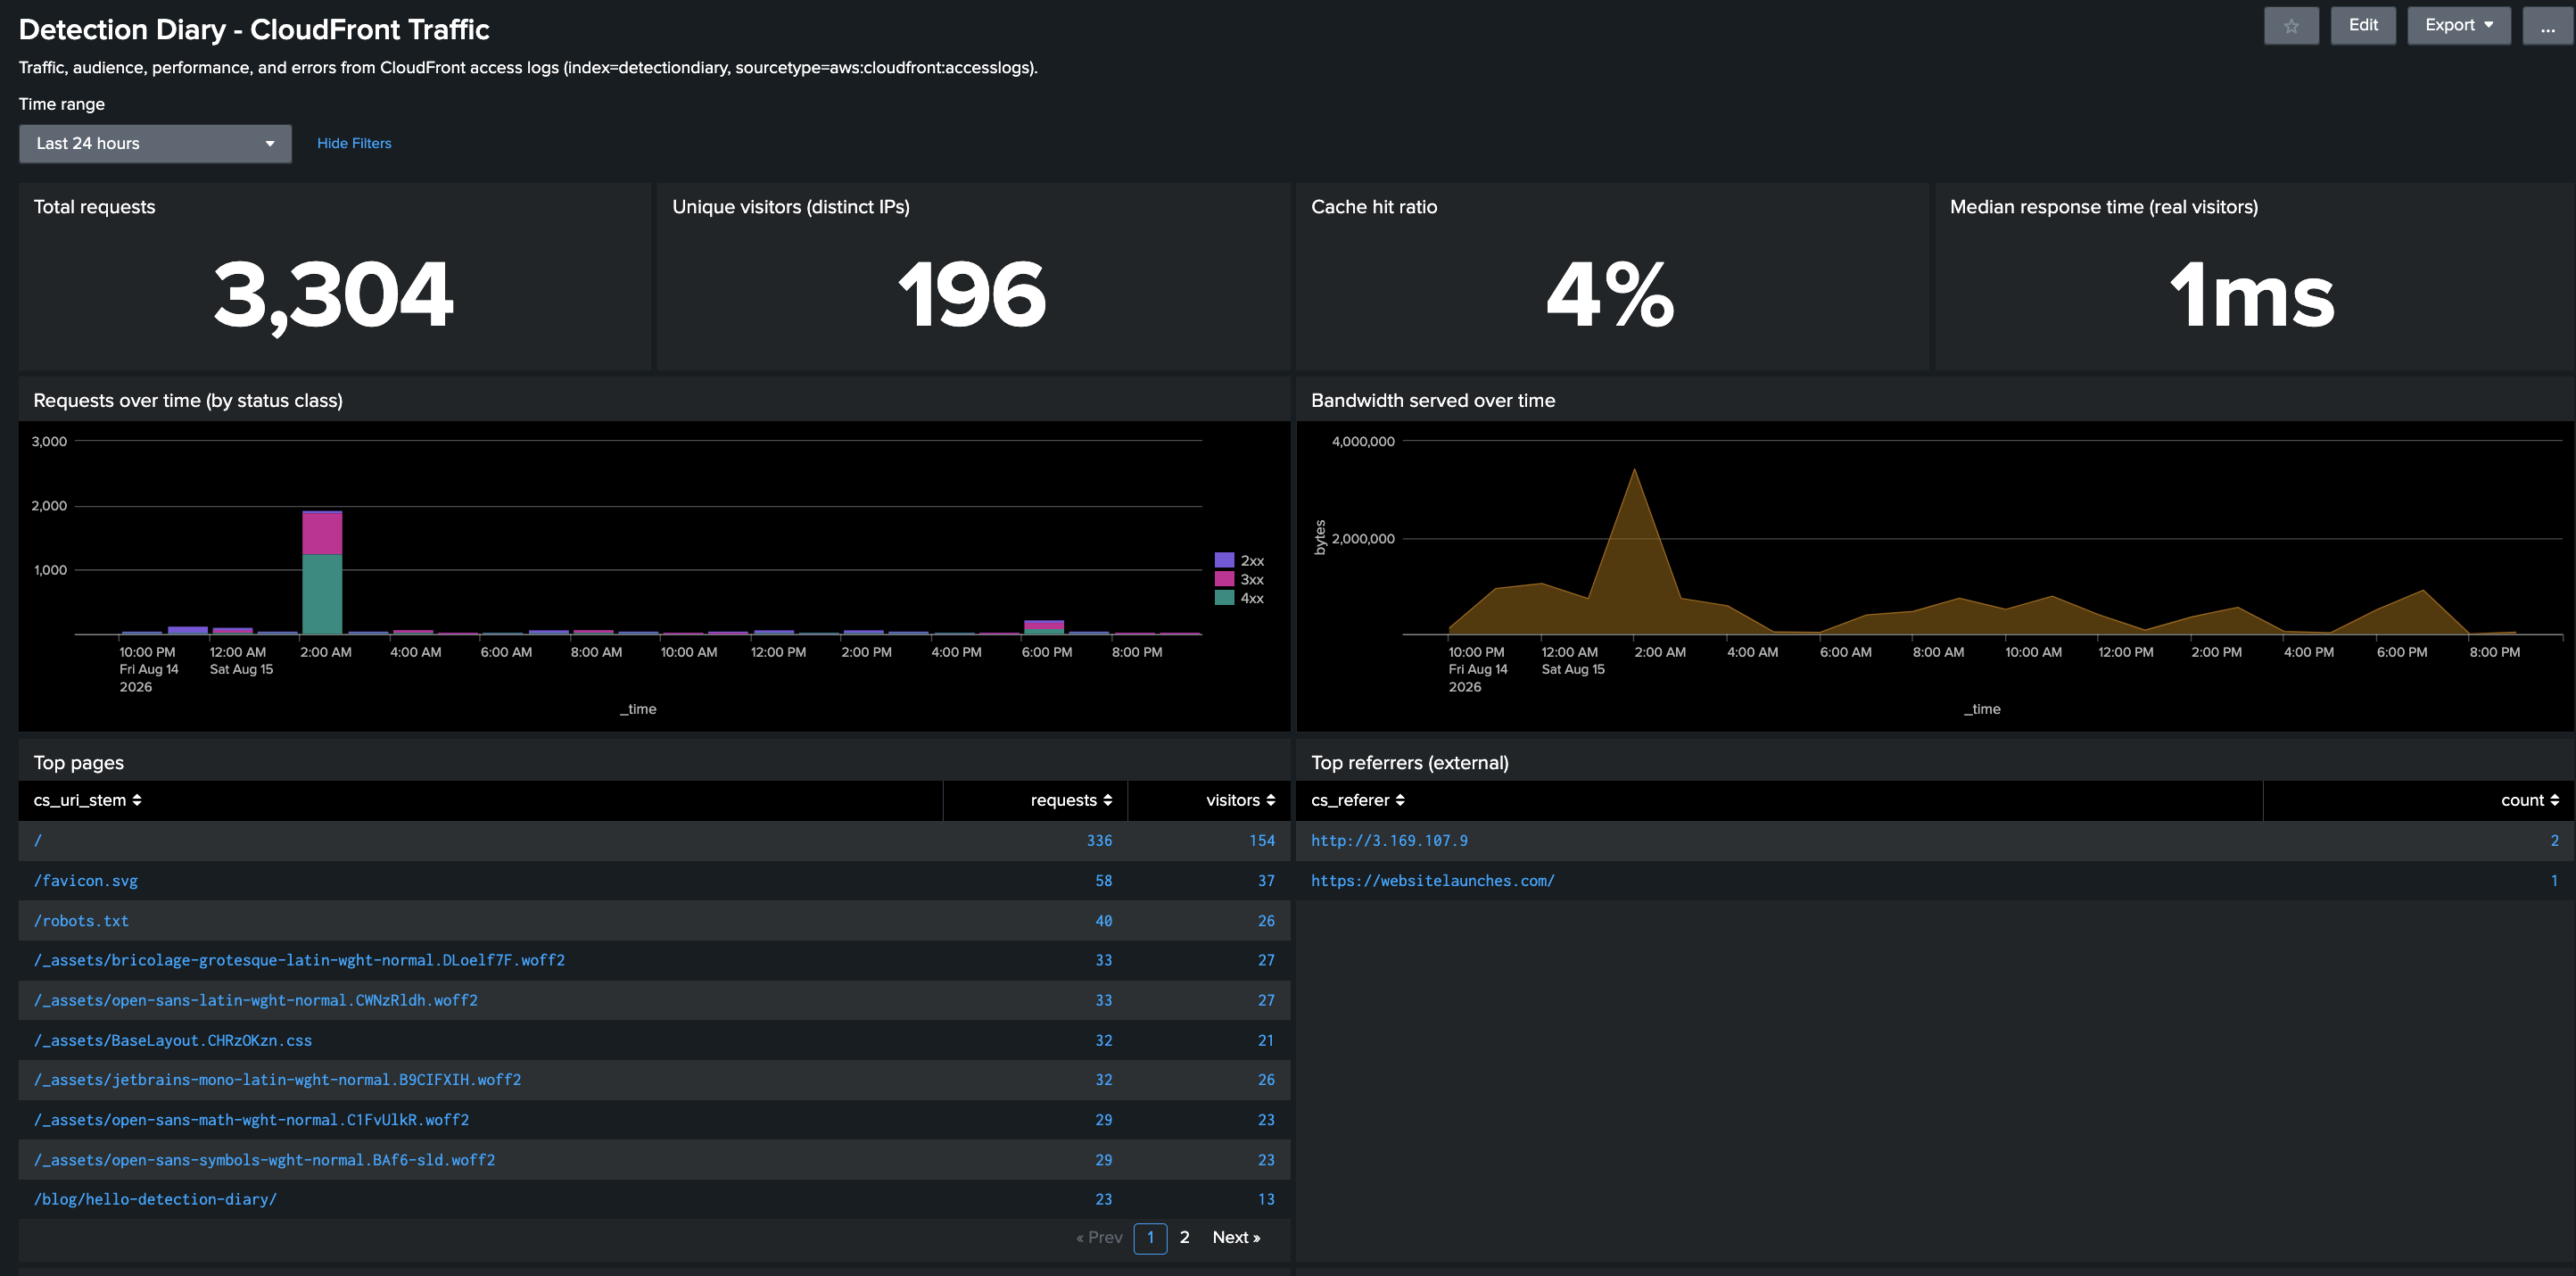
So, this was a fairly straightforward post where I wanted to talk about an example detection I made for this specific blog site and how I will be monitoring changes and data that may come out of this. This has been up for maybe 24 hours and we already see some pretty interesting scanning activity across the site from random scanners looking for vulnerabilities and trying to see if they can find any env files. Its pretty funny, but makes sense. We had one IP from the United Kingdom send over 2000 requests at 2 AM EST today and everything was 404s from them trying random URLs like wordpress locations that dont exist.
Overall, this was a fun first “post” to create and hopefully, over time, I get better at writing and sharing my thoughts. If there is anything you have a question about or want to chat with me about, feel free to connect and chat with me on LinkedIn.